Calculate fractal Dimension using the height variation method
Usage
fd_hvar(
  data,
  lvec,
  regmethod = "mean",
  keep_data = FALSE,
  plot = FALSE,
  parallel = FALSE,
  ncores = (parallel::detectCores() - 1)
)
Arguments
- data
Digital elevation model of class RasterLayer or dataframe (output of hvar function)
- lvec
Vector of scales to use for calculation.
- regmethod
Method to use for linear regression between scale (lvec) and height range. One of
raw(all data),mean(default)medianorends(minimum and maximum scale only)- keep_data
Keep the data used for fd calculation? defaults to FALSE
- plot
Logical. Show plot of scales relative to data?
- parallel
Logical. Use parallel processing? Note: parallel must be installed.
- ncores
Number of cores to use when parallel = TRUE.
Details
Calculates fractal dimension using the height variation regression.
If lvec is not specified, a default based on resolution and extent will be used.
data can be a DEM or a data.frame with columns labeled l and h for
grid cell length and height range of that cell, respectively (output of hvar()).
A rule of thumb is that l should range an order of magnitude.
However, large ranges also
average-out fractal dimension of a surface that might have
phase transitions, and therefore a thorough exploration of height ranges is suggested using the plot.
regmethod specifies whether data is summarized by taking the mean or median of height ranges across scales or all data is used.
regmethod "raw" is not recommended because the regression will give much more weight to the lower scales that include more points and likely underestimate D.
Examples
# \donttest{
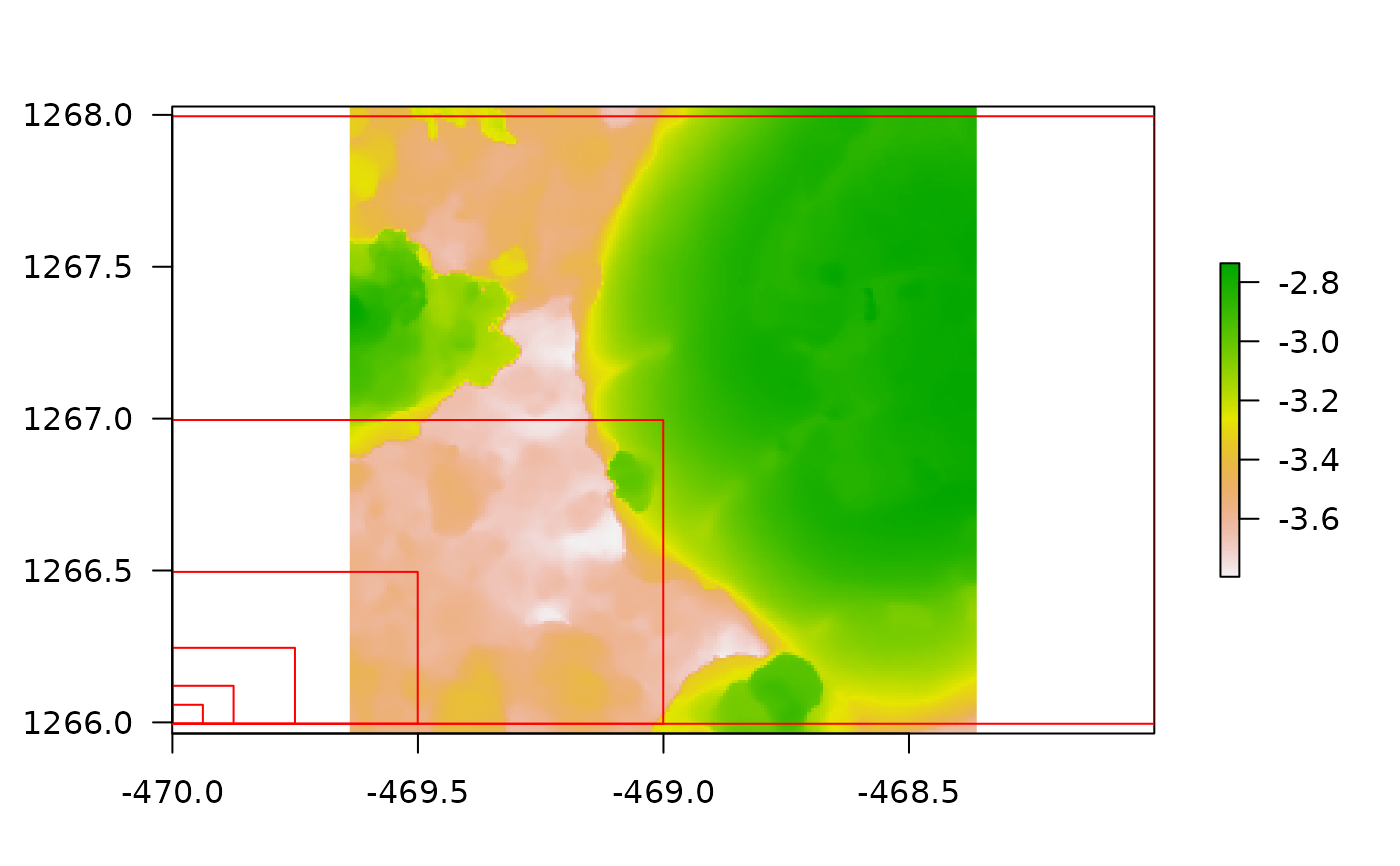
dem <- habtools::dem_crop(horseshoe, x0 = -469, y0 = 1267, L = 2, plot = TRUE)
 fd_hvar(dem, lvec = c(0.125, 0.25, 0.5, 1, 2))
#> [1] 2.215566
fd_hvar(dem, regmethod = "mean", plot = TRUE, keep_data = TRUE)
#> lvec is set to c(0.062, 0.125, 0.25, 0.5, 1, 2).
fd_hvar(dem, lvec = c(0.125, 0.25, 0.5, 1, 2))
#> [1] 2.215566
fd_hvar(dem, regmethod = "mean", plot = TRUE, keep_data = TRUE)
#> lvec is set to c(0.062, 0.125, 0.25, 0.5, 1, 2).
 #> $D
#> [1] 2.145523
#>
#> $lvec
#> [1] 0.0625 0.1250 0.2500 0.5000 1.0000 2.0000
#>
#> $data
#> l h
#> 1 0.0625 0.05967467
#> 2 0.1250 0.13053990
#> 3 0.2500 0.25134412
#> 4 0.5000 0.47317257
#> 5 1.0000 0.87658044
#> 6 2.0000 1.05967593
#>
#> $method
#> [1] "hvar"
#>
fd_hvar(dem, regmethod = "median", plot = TRUE, keep_data = TRUE)
#> lvec is set to c(0.062, 0.125, 0.25, 0.5, 1, 2).
#> $D
#> [1] 2.118973
#>
#> $lvec
#> [1] 0.0625 0.1250 0.2500 0.5000 1.0000 2.0000
#>
#> $data
#> l h
#> 1 0.0625 0.05613654
#> 2 0.1250 0.13097851
#> 3 0.2500 0.27393017
#> 4 0.5000 0.63257221
#> 5 1.0000 0.91977016
#> 6 2.0000 1.05967593
#>
#> $method
#> [1] "hvar"
#>
fd_hvar(dem)
#> lvec is set to c(0.062, 0.125, 0.25, 0.5, 1, 2).
#> [1] 2.145523
# }
#> $D
#> [1] 2.145523
#>
#> $lvec
#> [1] 0.0625 0.1250 0.2500 0.5000 1.0000 2.0000
#>
#> $data
#> l h
#> 1 0.0625 0.05967467
#> 2 0.1250 0.13053990
#> 3 0.2500 0.25134412
#> 4 0.5000 0.47317257
#> 5 1.0000 0.87658044
#> 6 2.0000 1.05967593
#>
#> $method
#> [1] "hvar"
#>
fd_hvar(dem, regmethod = "median", plot = TRUE, keep_data = TRUE)
#> lvec is set to c(0.062, 0.125, 0.25, 0.5, 1, 2).
#> $D
#> [1] 2.118973
#>
#> $lvec
#> [1] 0.0625 0.1250 0.2500 0.5000 1.0000 2.0000
#>
#> $data
#> l h
#> 1 0.0625 0.05613654
#> 2 0.1250 0.13097851
#> 3 0.2500 0.27393017
#> 4 0.5000 0.63257221
#> 5 1.0000 0.91977016
#> 6 2.0000 1.05967593
#>
#> $method
#> [1] "hvar"
#>
fd_hvar(dem)
#> lvec is set to c(0.062, 0.125, 0.25, 0.5, 1, 2).
#> [1] 2.145523
# }